Now with UPS, GPU and Windows service support

Your servers,
in your pocket

Real-time metrics, threshold alerts and hands-on control for every machine in your homelab — from a native Android app that talks straight to your own hardware. Nothing leaves your network.

Free to start · Open-source agent · Linux, Windows & Unraid · No account required

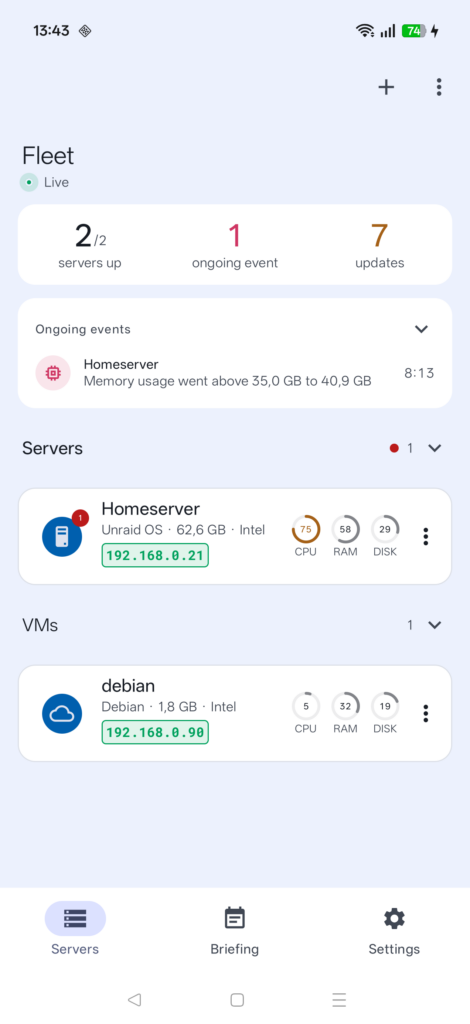
Monitee fleet overview: three of three servers up, one ongoing memory event, and CPU, RAM and disk for a Debian, a Windows and an Ubuntu host
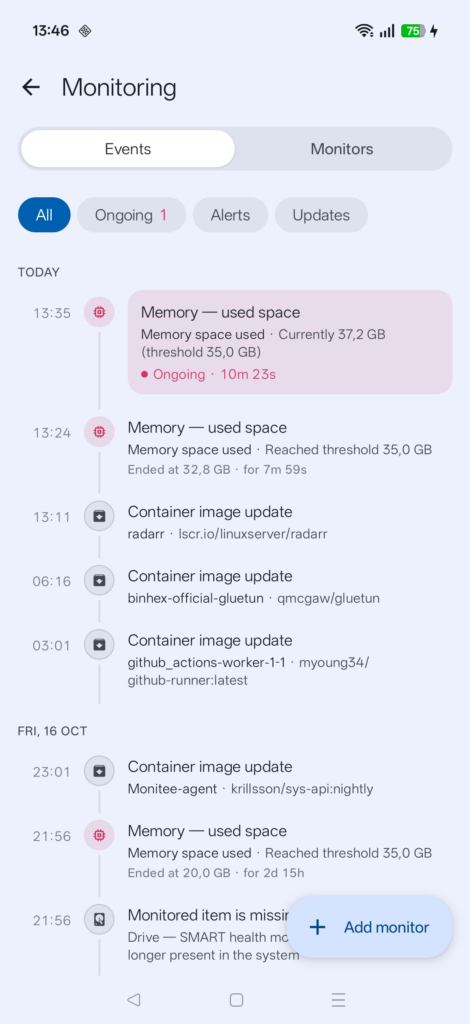
Monitee monitoring timeline with an ongoing free-memory event above a history of container image updates
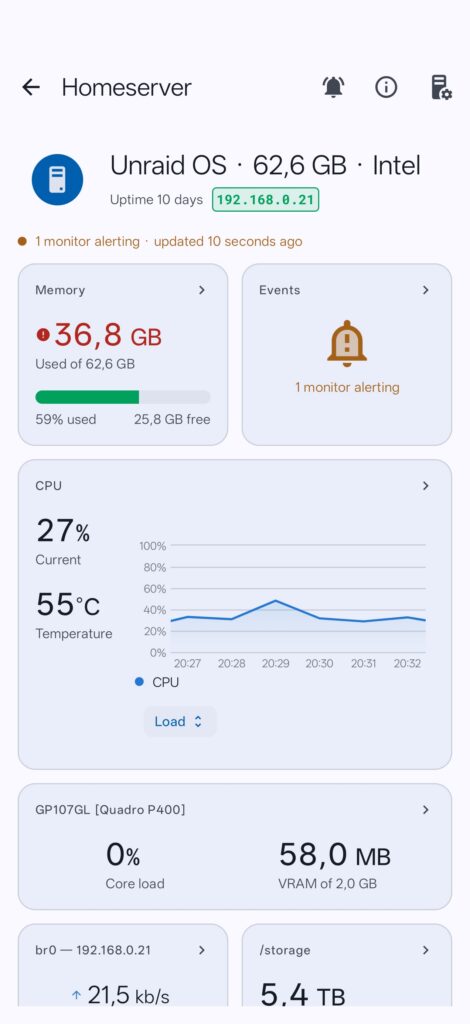
Monitee server detail for a Debian host: memory at 76 percent with a monitor alerting, and a CPU chart at 27 percent and 47 degrees
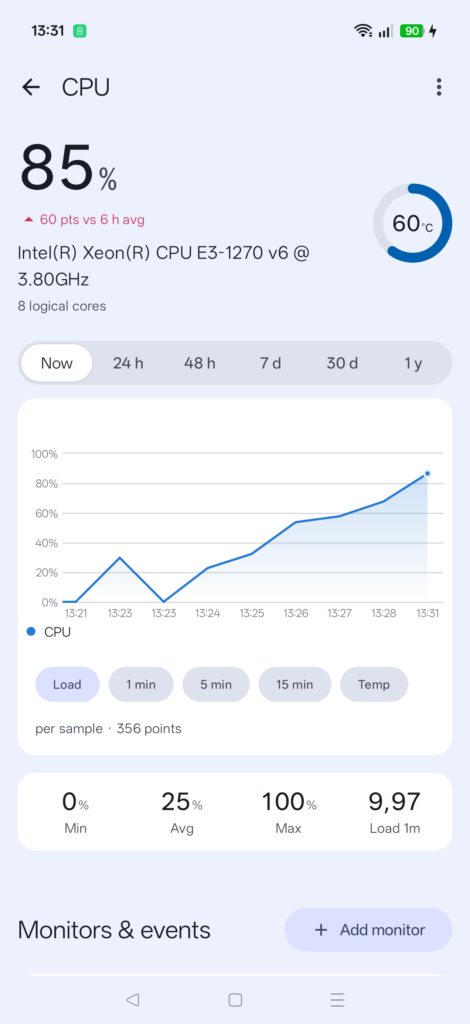
Monitee CPU detail for a Xeon E3-1270 v6: load history chart, 38 percent usage and 43 degrees
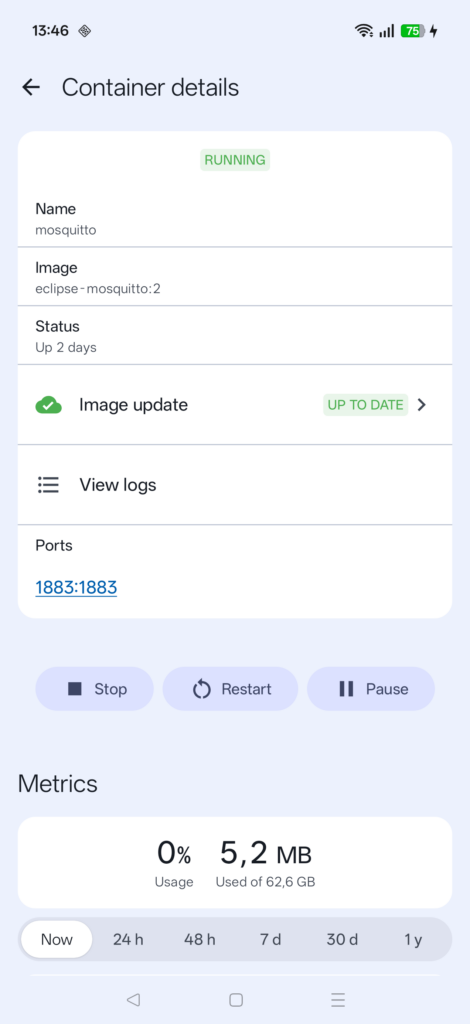
Monitee Docker container detail for mosquitto, running, with stop, restart and pause controls

Trusted by homelabbers

Already running on servers like yours

Excellent app, easy to setup. I bought since it was cheap compared to other pricy monitors
Google Play review
Super clear. Please add another SSH client.
Translated from German

Super Übersichtlich. Bitte noch einen SSH Client einfügen.

Google Play review
Very good, with it I can monitor my server in detail, having the practicality that a smartphone offers.
Translated from Portuguese

Muito bom, com ele consigo monitorar o meu servidor detalhadamente, tendo a praticidade que o smartphone oferece.

Google Play review
amazing app thank you
Google Play review
Super useful!
Google Play review
What's I needed to monitor my computers! Super!
Google Play review

Ratings and downloads come straight from Google Play. Quotes are real reviews, picked by hand.

Capabilities

Not just graphs. Actual control.

Most monitoring tools show you that something broke. Monitee lets you fix it from the same screen.

Real-time metrics

CPU, memory, disks, filesystems, processes and network interfaces — sampled live and kept as history you can scrub through by day.

Threshold alerts

Set a monitor on any value — "CPU temperature above 90°C for 30 seconds" — and get a push notification the moment it trips, plus one when it recovers.

Docker control

Start, stop, restart and pause containers. Read their logs and per-container resource use.

Services

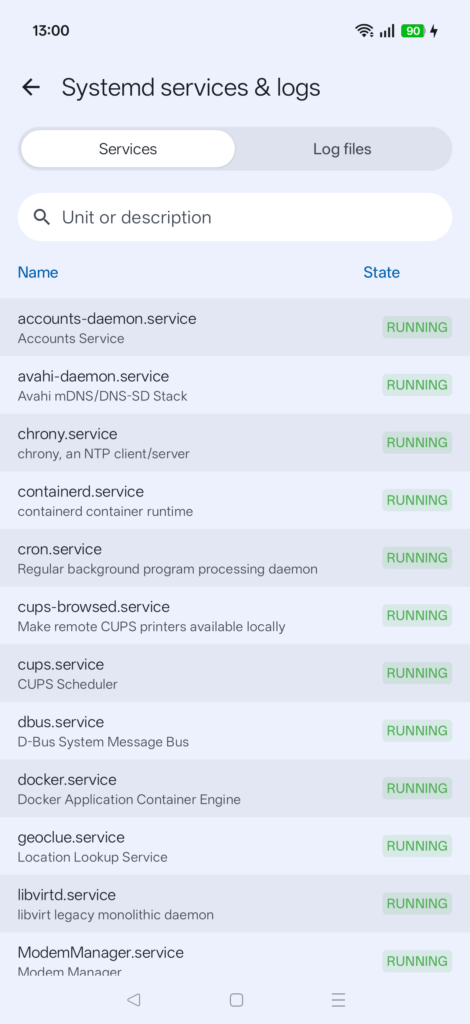
Manage systemd units on Linux and services on Windows without opening a shell.

Web checks

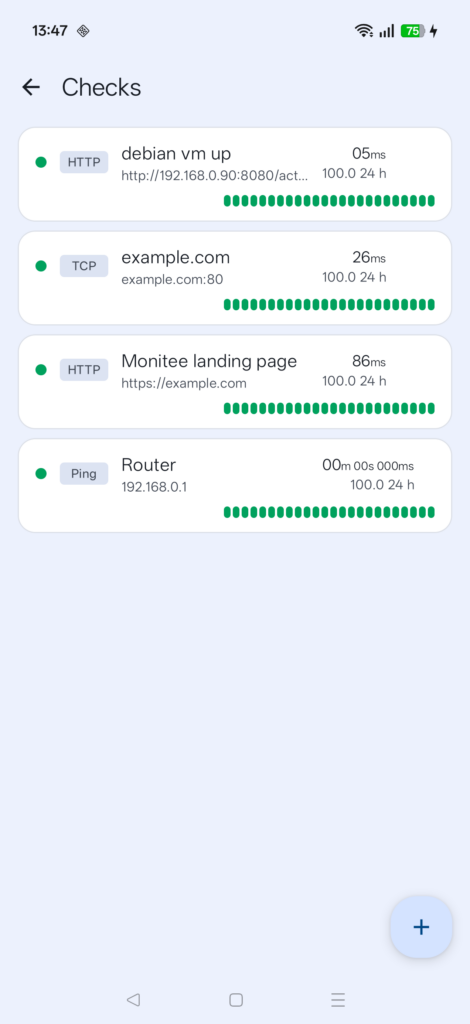
Poll any HTTP endpoint for status, latency and certificate expiry.

Log reader

Tail and search log files on the host, straight from your phone.

UPS

Battery charge, load and runtime remaining, with alerts on mains loss.

GPU

Utilisation, VRAM and temperature for the cards doing your transcoding.

Free covers one server, refreshed every minute, with current values on every screen. History charts, processes, logs, Docker actions and alerts are Pro — detailed below.

Fleet view

Every box, one screen

Open the app and the answer is already there: how many servers are up, what is currently wrong, and which machine is the problem. CPU, RAM and disk for each host, colour-coded so you read it in a glance, not a query.

  • Unraid, Ubuntu, Debian, Proxmox and Windows hosts side by side
  • Per-host CPU, memory and disk at a glance
  • Ongoing events surfaced above the fold
Monitee fleet overview showing three of three servers up, one ongoing memory event, and per-server CPU, RAM and disk percentages for a Debian, a Windows and an Ubuntu host

Alerting

Know before you are told

Define a monitor against any metric and Monitee watches it for you. When a threshold is breached you get a push notification with the value and the duration — and a second one when it recovers, so you know whether it still needs you.

  • Thresholds with a hold time, so transients do not page you
  • Ongoing and resolved events on one timeline
  • Recovery values recorded, not just the breach
Monitee monitoring timeline listing an ongoing free-memory event, breached eight minutes ago, above a history of past notices

Control

Fix it from the sofa

A container wedged itself again. Stop it, restart it, read its logs and check its memory use — without finding a laptop, opening a VPN and remembering the compose directory.

  • Start, stop, restart and pause Docker containers
  • systemd units on Linux, services on Windows
  • Container and host log files, tailed live
Monitee Docker container detail screen for mosquitto with running status, port mapping and stop, restart and pause buttons

Monitee Pro

Free watches one server. Pro watches all of them.

A one-off upgrade, not a subscription. It is what lets this app have no ads, no tracking and no data to sell — the only thing it needs from you is the upgrade.

Your whole fleet, live

  • Unlimited servers Add every machine you run — the one-server limit is gone.
  • Real-time metrics A ten-second refresh, instead of once a minute.
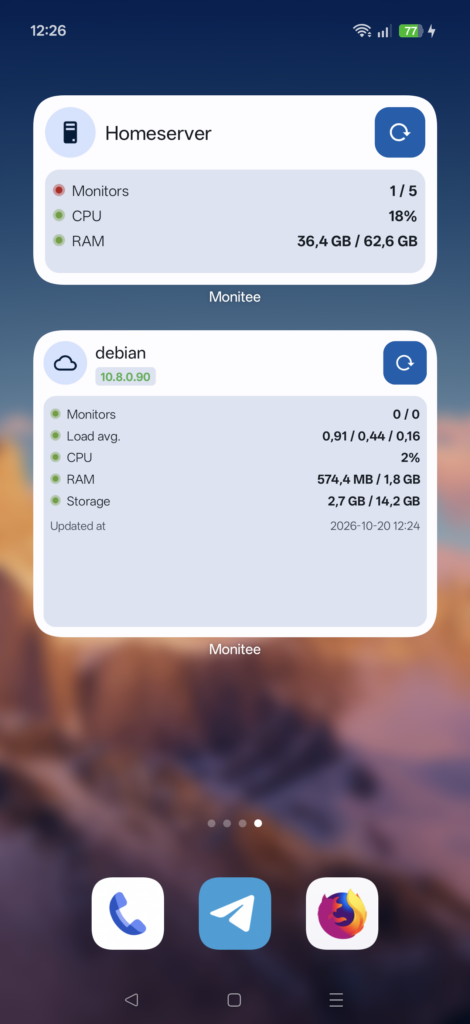
  • Home-screen widget A server's vitals on your home screen, without opening the app.

Go deeper into every server

  • Full history charts Every detail screen opens on free and shows current values. Pro adds the history behind them — networks, disks, filesystems, UPS and GPUs.
  • Live process explorer See what is eating CPU and memory, and kill a runaway process.
  • Live log reader Open and follow any log file on the server.

Know before it breaks

  • Threshold monitors & alerts A push notification when CPU, memory or disk crosses your limit.
  • Website & uptime checks Response times and downtime tracking for any endpoint.

Act from anywhere

  • Docker control The container list is readable on free. Opening one to start, stop, restart it or follow its logs is Pro.
  • systemd & Windows services Start and stop services, and read their logs.

Pro also covers ntfy push notifications and a photo for each server.

Free forever

What you get without paying anything

One server, refreshed every minute. Full overview and live current metrics on every detail screen — history charts, processes, logs, Docker actions, monitors and alerts are Pro.

  • No trial, no timer, no account, no ads
  • The server agent, open source and unrestricted

Already bought the app back when it was paid? You get Pro — email me and I will sort it. You should not pay twice for the same thing.

How the migration works

Self-hosted by design

There is no cloud. It’s just your server.

Monitee has no backend. The app connects directly to an open-source agent you install on your own machine, over your own network. There is no account to create, no telemetry, and no company sitting between you and your hardware — including us.

Reach it on your LAN as 192.168.0.166 or over your own VPN or reverse proxy as example.com.

  • No account. Add a host by address and credentials. That’s the whole signup.
  • No third-party transfer. Metrics travel from your server to your phone and stop there.
  • Auditable agent. The server component is open source — read it before you run it.
  • Works offline. No internet dependency on your own LAN.

Setup

Runs on the hardware you already have

Unraid Ubuntu Debian Proxmox Windows Raspberry Pi TrueNAS Docker Home Assistant Synology

Whichever of those you run, there is a route below. They all end the same way: set a username and password, and the agent is up.

The general path

Docker Compose, start to finish

Four commands and one file to edit. The agent needs a fair number of mounts because it reads real hardware — disks, sensors, the journal, the Docker socket — and the shipped Compose file already has them, with comments explaining what each one buys you.

  • Set your login credentials in configuration.yml
  • Point the two /path/to/* volumes at real directories
  • Uncomment the disk devices you want temperatures for

Full Compose guide

bash
# create the layout
mkdir -p ~/monitee-agent/{config,data}
cd ~/monitee-agent

# grab the compose file and config
wget https://raw.githubusercontent.com/Krillsson/\
monitee-agent/master/docker-compose.yml
cd config && wget https://raw.githubusercontent.com/\
Krillsson/monitee-agent/master/config/configuration.yml

# set your credentials and volume paths
nano configuration.yml

# go
cd .. && docker compose up -d

Watch it come up with docker logs -f monitee-agent. You are looking for Tomcat started on ports 8443 (https), 8080 (http).

Last step

Then add it in the app

Open Monitee and tap +. On your own network the agent announces itself over DNS-SD, so there is usually nothing to type — just sign in with the credentials you set.

Connection guide

192.168.0.166:8080 Connected

The app

Built like a native Android app, because it is one

Material You, light or dark to match your phone, and fast enough to check while the kettle boils.

Server detail screen with live memory, CPU and GPU readouts
CPU detail screen with a load average history chart
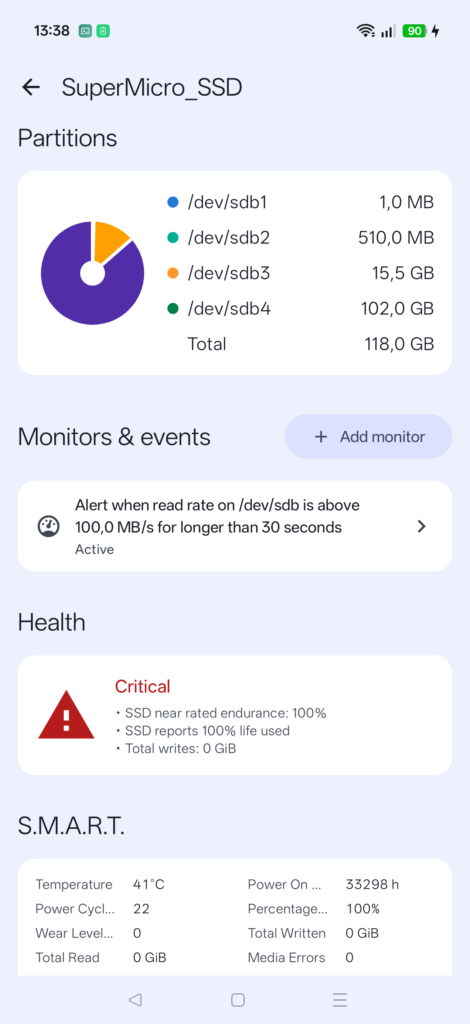
Drive detail screen with a partition breakdown and S.M.A.R.T. health
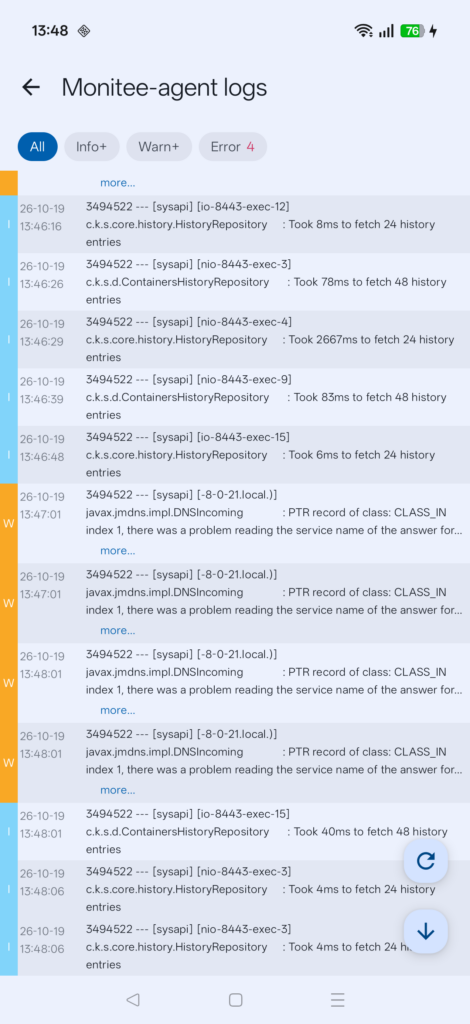
Container log viewer with colour-coded severity gutters
systemd service management screen
Windows service management screen
Web server check results with response status and latency
UPS status screen showing battery charge and load
GPU list showing utilisation and VRAM per adapter
Log file browser listing system log paths and sizes
Add server screen with automatic service discovery

Questions worth asking first

What does it cost, and what is free?

Free covers one server, refreshed every minute, and it does not expire — no trial, no timer. You get the full overview and current metrics on every detail screen. Pro is a one-off upgrade, not a subscription: it lifts the one-server limit, drops the refresh to ten seconds, and adds the history charts, the process explorer, live log reading, Docker and service control, threshold alerts and uptime checks. The agent you run on your server is open source and free either way.

Why not just make it free and take ads?

Because an ad-funded monitoring app has an incentive to know things about you, and that is the opposite of what this product is for. Charging once for the advanced features means the only thing I need from you is the upgrade — no tracking, no ad SDK, no data to sell. If you already bought the app back when it was paid, email me and you get Pro; you should not pay twice for the same thing.

Is there an iOS version?

Not today. Monitee is a native Android app. The agent exposes a documented API, so an iOS client is possible — but it is not something I am building right now.

Can I use it away from home?

Yes, but you decide how. Monitee talks to whatever address you give it, so a VPN back to your network (WireGuard, Tailscale) or your own reverse proxy with TLS both work. There is no relay service in the middle, which is exactly the point.

How heavy is the agent?

Light enough to leave running on a Raspberry Pi. It samples metrics on an interval and keeps a rolling history locally — no external database to stand up.

How is this different from Grafana or Netdata?

Those are dashboards you open on a desktop. Monitee is a phone-first app that also lets you act — restart the container, stop the service, read the log — instead of only showing you the graph. Plenty of people run both.

What does it need access to?

The agent reads system metrics and, where you enable it, talks to the Docker socket and the service manager so it can control containers and units. Everything it can do is visible in the source.

Does the app collect anything about me?

Crash reports, via Firebase Crashlytics, so I can fix what breaks. Beyond that there is opt-in analytics that shows me which features get used in aggregate — off unless you turn it on, and the app works identically either way. Your server metrics are never part of any of it: those go from your agent to your device and nowhere else. If you want to verify rather than trust me, run the app behind NetGuard and watch the hosts it talks to; anything other than your own servers and Crashlytics is a bug, and I want to hear about it.

Stop guessing whether it’s still up

Install the agent, add your first server, and have your homelab on your lock screen tonight.

Free, no account, and you can read the agent’s source before you run it.